John Oreopoulos
2014-05-01 12:16:24 UTC
Hello, I'm writing this email on behalf of a colleague who is not part of the ImageJ email listserver. This person is wondering if there is an existing macro or plugin that can automatically find and measure the widths of peaks in an image of point-sources of light. For example, his images might look like this one:
Loading Image...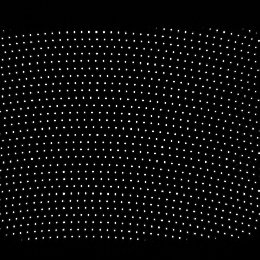
The macro/plugin would ideally find each source of light (in this case a pinhole in a Nipkow disk), fit a Gaussian distribution to this point-source along x and y line profiles drawn through the point, then extract the standard deviation / FWHM of both fits, and finally log the results into a text file.
So far I've been able to construct a simple macro that finds the pinholes using the analyze particles function (searching for centroids) and limiting to a threshold, and then using the xy coordinates of the centroids to act as positions for drawing line profiles through. I think the next step would be to use ImageJ's curve-fitting algorithm to get the fitting data.
Again, not want to re-invent the wheel here, so just wanted to check if there's something out there that can already do this. Would the MetroloJ plugin work in this situation, or does that only work with single points of light in an image (like a fluorescent bead in a micrograph)? My colleague would also ideally have the ability to do this calculation rapidly on the fly as the image is acquired (with maybe a few seconds delay maximum). Maybe MicroManager could do this through it's scripting functions?
Any help here is much appreciated!
Sincerely,
John Oreopoulos
Staff Scientist
Spectral Applied Research Inc.
A Division of Andor Technology
Richmond Hill, Ontario
Canada
www.spectral.ca
--
ImageJ mailing list: http://imagej.nih.gov/ij/list.html
Loading Image...

The macro/plugin would ideally find each source of light (in this case a pinhole in a Nipkow disk), fit a Gaussian distribution to this point-source along x and y line profiles drawn through the point, then extract the standard deviation / FWHM of both fits, and finally log the results into a text file.
So far I've been able to construct a simple macro that finds the pinholes using the analyze particles function (searching for centroids) and limiting to a threshold, and then using the xy coordinates of the centroids to act as positions for drawing line profiles through. I think the next step would be to use ImageJ's curve-fitting algorithm to get the fitting data.
Again, not want to re-invent the wheel here, so just wanted to check if there's something out there that can already do this. Would the MetroloJ plugin work in this situation, or does that only work with single points of light in an image (like a fluorescent bead in a micrograph)? My colleague would also ideally have the ability to do this calculation rapidly on the fly as the image is acquired (with maybe a few seconds delay maximum). Maybe MicroManager could do this through it's scripting functions?
Any help here is much appreciated!
Sincerely,
John Oreopoulos
Staff Scientist
Spectral Applied Research Inc.
A Division of Andor Technology
Richmond Hill, Ontario
Canada
www.spectral.ca
--
ImageJ mailing list: http://imagej.nih.gov/ij/list.html